+70
°
F
+74°
+58°
Niagara Falls
Thursday, 16
See 7-Day Forecast
Featured News - Current News - Archived News - News Categories
UB geographer created ‘Color Buffalo’ mapping tool to help people relax & connect with their city
By the University at Buffalo
With many Buffalonians engaged in social distancing, a University at Buffalo geography researcher is giving people a new way to connect with their city without leaving home.
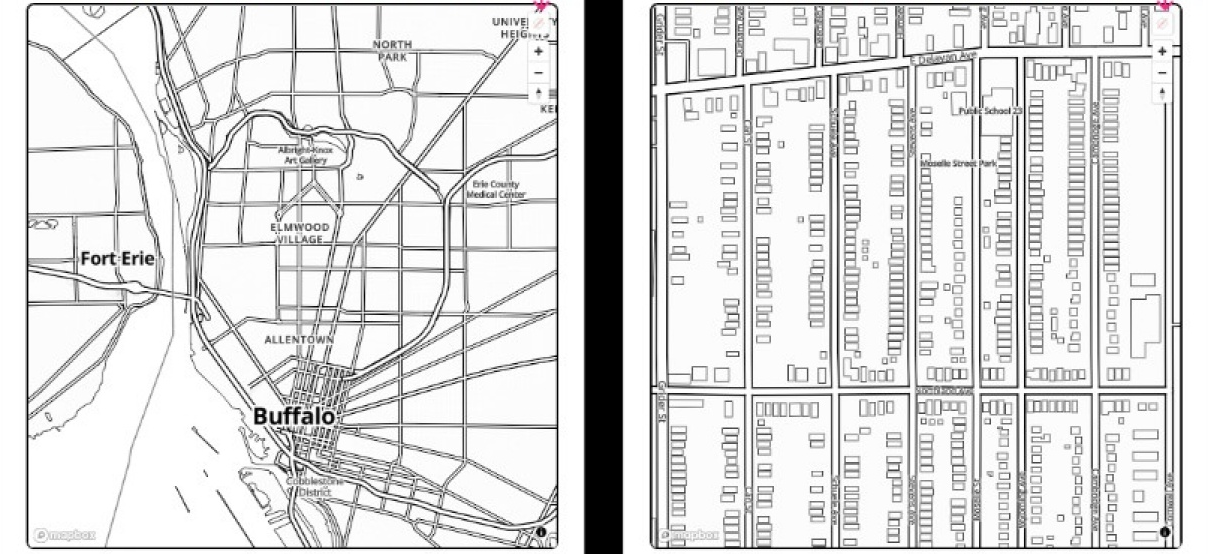
Monica Stephens created the “Color Buffalo” map, a printable coloring book that lets people create customized maps for offline coloring or painting. Found online, “Color Buffalo” enables users to zoom in on a map of Buffalo to produce a coloring page of a city block, or to zoom out to print pages of the entire region. The close-up areas of the map that fall within the City of Buffalo show the outline of buildings and streets.
“I made this map/web app for families or anyone else who would enjoy a coloring book of Buffalo,” says Stephens, Ph.D., assistant professor of geography in the UB College of Arts and Sciences. “We’re all going through a really stressful time right now, and I designed the map to help people de-stress by making art without more screen time. I also needed to entertain my kid in an educational way, as he’s at home learning about the neighborhood, geography and art.
“My students use this technology to design and deploy web maps for a variety of community-driven purposes. I thought a coloring book would be an application many families could use right now while we work and learn from home.”
Kids can use the map as a learning activity by identifying their house; drawing in missing features, like cars, dogs or potholes; or color-coding their neighborhood according to themes such as the number of trees on a block.
Stephens is asking people who want to share photos of their creations to use the hashtag #ColorBuffalo on social media.
The mapping tool works best in the Google Chrome browser, as other browsers may not enable users to print the map, Stephens says.
The inspiration for “Color Buffalo” came from a map-based coloring book made by a company called Mapbox, which partners with one of Stephens’ cartography classes to help students develop web maps for community-driven causes, Stephens says.
After learning about the Mapbox book, which is a PDF that can’t be altered, Stephens set out to create a version for Buffalo that was interactive and could be printed directly from the web. This would enable people to find and color any neighborhoods or regions they want. (The online tool also has a “click for your location” button that generates a map based on where a user is located).
To build “Color Buffalo,” Stephens combined open-source data and interactivity features from Mapbox and OpenStreetMap (OSM) with detailed building footprints that were digitally generated by Microsoft, but are not accurate enough to rely on for planning or emergency purposes.
For people who may be interested in creating similar tools for other places, Stephens explains the process in a short write-up found at the bottom of the “Color Buffalo” map: “This experiment was inspired by the Mapbox coloring book. As buildings in Buffalo are missing from OSM data, I added the Microsoft building footprints for Buffalo to the monochrome style. I then modified paper.css to create a printable page.”


1859 Whitehaven Road, Grand Island, NY 14072
Phone: 716-773-7676
Fax: 716-773-7190