
+70
°
F
+74°
+58°
Niagara Falls
Thursday, 16
See 7-Day Forecast
Featured News - Current News - Archived News - News Categories
By the University at Buffalo
In a few short months, an interdisciplinary team of University at Buffalo researchers has reoriented its focus from academic pursuits in order to model the local transmission of COVID-19 cases. Now, with the first wave of cases subsiding, members are turning their attention to modeling the effects of reopening the local economy.
Their early experience with the models has continued to be instructive. As they refined their early models, which were then presented to local providers and the Erie County Department of Health, they began to realize the initial fears that local hospitals could be overwhelmed by COVID-19 cases would not be realized.
“We were lucky in the fact that we didn’t have as many cases as New York City did by the time Erie County closed businesses and schools,” said Gabriel Anaya, M.D., a clinical informatics fellow in the department of biomedical informatics in the Jacobs School of Medicine and Biomedical Sciences at UB. Anaya and Sarah G. Mullin, a doctoral student in biomedical informatics are playing crucial roles in developing the models. “That had a big effect on us, a big plus in Erie County.”
“We are very lucky to live in a place where we are going through phases,” Mullin agreed. “We’ve been in a state of government mitigation since almost the beginning of the pandemic in the county.”
Peter L. Elkin, M.D., chair of the department of biomedical informatics, who is supervising Mullins and Anaya, added: “The self-quarantining and social distancing measures we took meant we had only about 40% of the hospitalizations and deaths we would have had otherwise. But that advantage also shows the downside of what will happen if we reopen too quickly.”
Modeling Interventions
Anaya and Mullin are modeling how different interventions will affect the local spread of the virus.
“We know that if half the population uses face masks we can mitigate increasing cases,” Anaya said. “But it depends on how consistent people are with face mask use.”
Statistics they are incorporating into their models will reflect changing realities on the ground, such as the reduction in social distancing. That, in turn, allows them to give more accurate information to hospitals and the DOH, which will then be used to develop policies.
As the team members did before – when cases and hospitalizations increased locally – they will again look to other countries that have already begun to reopen their economies to see what might be in store for Erie County.
“For example, South Korea had another spike in cases, so we are looking to see how they deal with it to inform how we might deal with a future spike in cases as we reopen,” Mullin said. “It’s this continual consumption of information that we then incorporate into our models. That will probably continue until we have a vaccine or a drug.”
Real Data
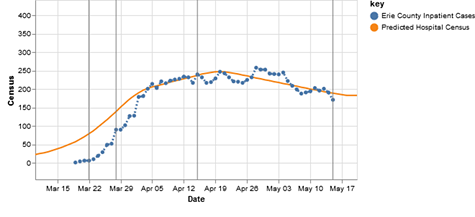
According to Elkin, a key advantage of the models that Mullin, Anaya and their colleagues have developed is that the models include not just the predicted curve of cases or hospitalizations, but also social distancing, infected but asymptomatic individuals and people transferred to the ICU. Understanding the features of the pandemic leads to higher predictive accuracy of the models. For example, he said, the graph (pictured) demonstrates how closely the data (in blue) followed their prediction (in gold).
“It shows how well our predicted curve matched what happened,” he said.
The intense effort to get all hands on deck started with a simple email between Anaya and Mullin in March. “How busy are you?” was the urgent question.
Mullin responded: “Well Gabe, you know I’m busy. But we’re in a pandemic. Let me know what you need.”
Within hours, Elkin had redistributed some of Mullin’s work so that she and Anaya could start collaborating to develop and adapt existing epidemiological models to the local COVID-19 epidemic.
The collaboration between Anaya and Mullin has continued to be productive, with Mullin’s expertise in using ontology, the study of organizing and categorizing knowledge, to provide more accurate predictive analytics complementing Anaya’s expertise in clinical informatics, which leverages health care data from hospitals with new techniques to improve health care delivery.
That simple exchange expanded into a wide-ranging collaboration that continues to the present, with researchers throughout the department, the Jacobs School and the School of Public Health and Health Professions. All are working to gather and analyze data to reflect and forecast how the local COVID-19 epidemic will unfold.
“We never expected we’d be needed to this degree,” Anaya said.
The team works under the direction of Elkin and Jacobs School faculty member Peter Winkelstein, M.D., executive director of the Institute for Healthcare Informatics, clinical professor of pediatrics and chief medical officer at UBMD Physicians’ Group and Kaleida Health; along with School of Public Health and Health Professions faculty members Matthew R. Bonner, Ph.D., associate professor of epidemiology and environmental health; and Gregory E. Wilding, Ph.D., professor and chair of biostatistics.
Other trainees in the clinical informatics fellowship program who are helping with the model are Arlen B. Brickman, M.D.; Jinwei Hu, M.D.; and Brianne E. Mackenzie, M.D. Jonathan C. Blaisure, a doctoral student in biomedical informatics, is also part of the team.


1859 Whitehaven Road, Grand Island, NY 14072
Phone: 716-773-7676
Fax: 716-773-7190